 |
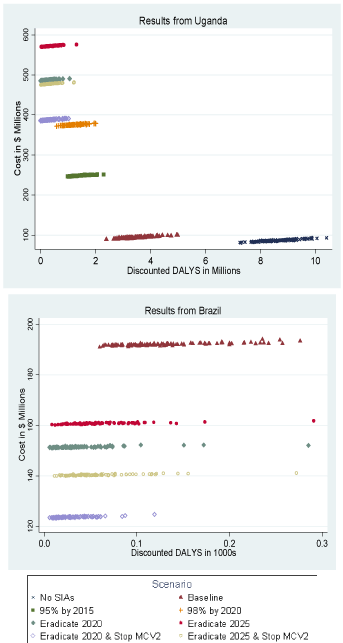
| Figure 2: Costs vs. measles DALYs for 8 scenarios in Uganda and Brazil. Each marker plots costs against DALYs emerging from a single iteration of the model. Policy makers prefer to be in bottom left with fewest DALYs and lowest costs. Stop SIAs and 95% and 98% mortality reduction scenarios are not modeled for Brazil, because Brazil has already eliminated measles. |