 |
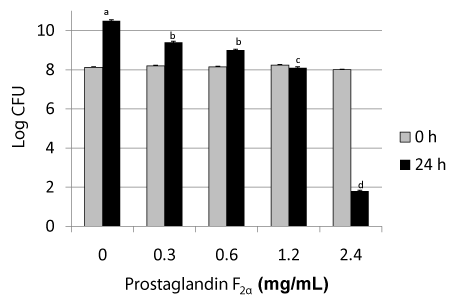
| Figure 1: Growth of S. aureus as measured by log colony forming units (CFU)/mL, treated with PGF2α at 0 h (gray bars) and 24 h (black bars) for each concentration of PGF2α a, b, c, d Bars designated by different letters are different (P<0.05) at 24 h. |