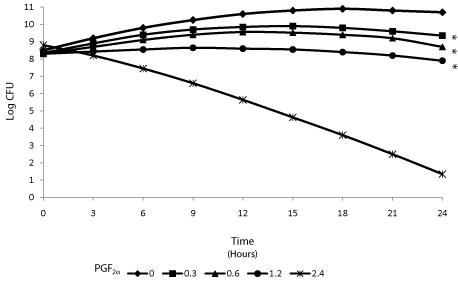
1Model: Y=β0+β1x+β2x2+ε1, where β0 represents y-intercept at time of inoculation; β1 represents the rate at which bacterial growth increases; β2 represents point of inflection where growth reached its maximum at a specific time; ε1 represents random error.
*Overall line of bacterial growth for each treatment differs (P<0.05) from control. The treatment 2.4 mg/mL was not included in contrasts.
The rate of bacterial growth over time (β1) was less (P<0.05) for 1.2 mg/ml PGF2α treatment when compared with 0 and 0.6 mg/mL treatment.