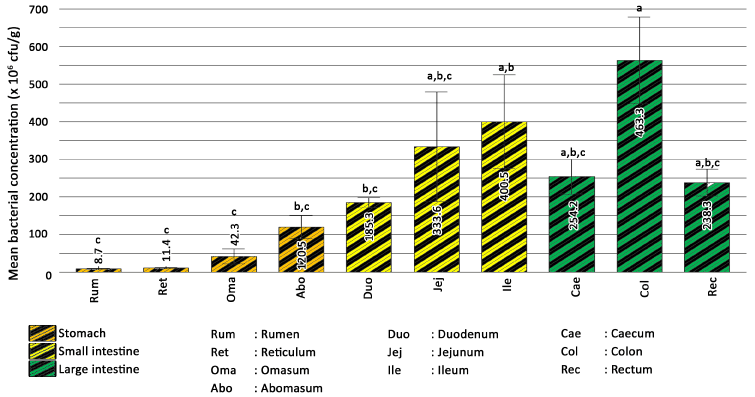
a,b,c,d,e Different superscripts indicate significant difference (p<0.05)
 a,b,c,d,e Different superscripts indicate significant difference (p<0.05) |
| Figure 5: Average (± SEM) comparison between concentrations of Pasteurella multocida B:2 in different parts of the luminal gastrointestinal tracts of Group 2 following experimental exposure. |