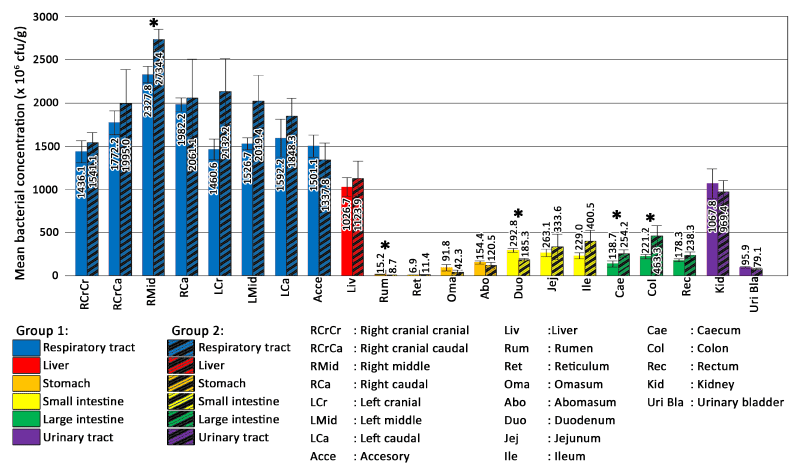
* indicates significant difference (p<0.05)
 * indicates significant difference (p<0.05) |
| Figure 6: Mean (± SEM) comparison between concentration of P. multocida B:2 in different parts of respiratory, gastrointestinal and urinary tracts of buffalo calves of Group 1 and Group 2 following experimental exposure. |