 |
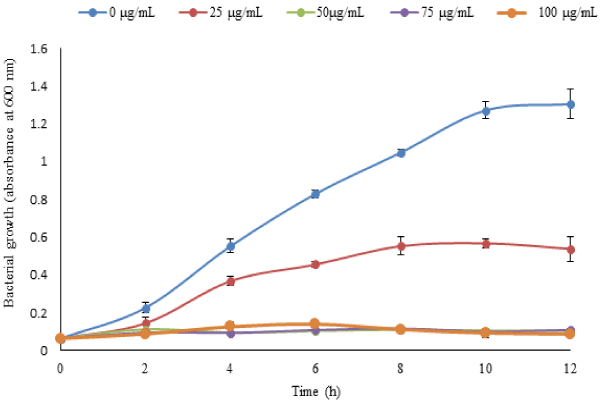
| Figure 2: Growth curves of V. tapetis exposed to different concentrations of CAgNCs. In growth inhibition assay , cell growth was assessed after treatment with CAgNCs (12.5, 25, 50 and 75 µg/mL) at 25 °C by measuring the OD at 600 nm at every 2 h intervals. The bars indicate the mean ± S.D (n=3). |