|
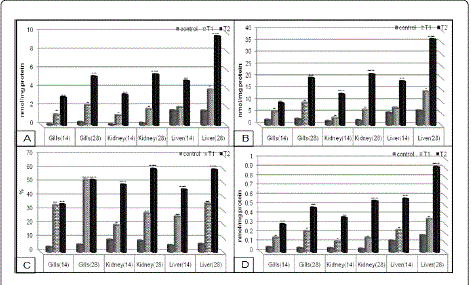
| Figure 1: Levels of Oxidative stress biomarkers (A): lipid peroxidation, (B): Carbonyl Protein, (C): DNA fragmentation and (D): Nitric Oxide in the gills, kidney and liver of C. gariepinus exposed to HgCl2 (T1=0.04 and T2=0.12 ppm) for 14 and 28 day. *Significant differences between treatments and control oxidative stress biomarkers (p<0:05). **Significant differences between treatments and control oxidative stress biomarkers (p<0:01). ***Significant differences between treatments and control oxidative stress biomarkers (p<0:001). |