 |
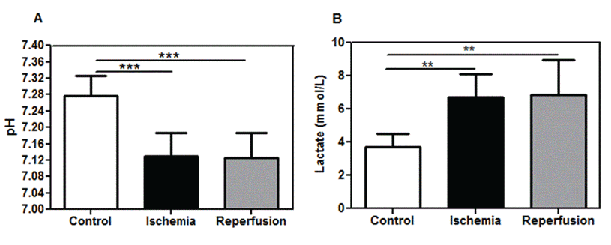
| Figure 3: The decrease of pH and consequently increase of lactate describes a lactate acidosis. (A) The pH value decreases after ischemia, remaining at this level in the reperfusion group. (B) The lactate level increased in the ischemic group, compared to control and reperfusion group. The statistical analysis determined using ANOVA and the Tukey post-hoc test (*P ≤ 0.05), (n=6/group). |