 |
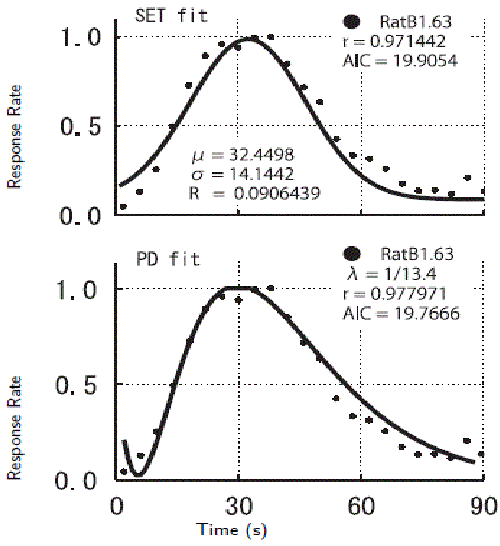
| Figure 1: Examples of the fit with SET (top panel) and with PD (lower panel) for the data from session 63 for RatB1. The rate of response R(t) or R63(t) is plotted on the vertical axis. The time t since the onset of the stimulus is plotted on the horizontal axis. Dots represent the mean rate at intervals of 4 s. The correlation coefficients (r) of these fits are 0.971 (SET) and 0.978 (PD), the Akaike information criterion (AIC) values are 19.91 (SET) and 19.77 (PD). For SET and PD, the values of r and AIC are similar and both models give a good fit. Although they are almost equally good as mathematical models for this data set, we can easily observe a difference in the shapes of the curves (adopted from Hasegawa and Sakata). |