 |
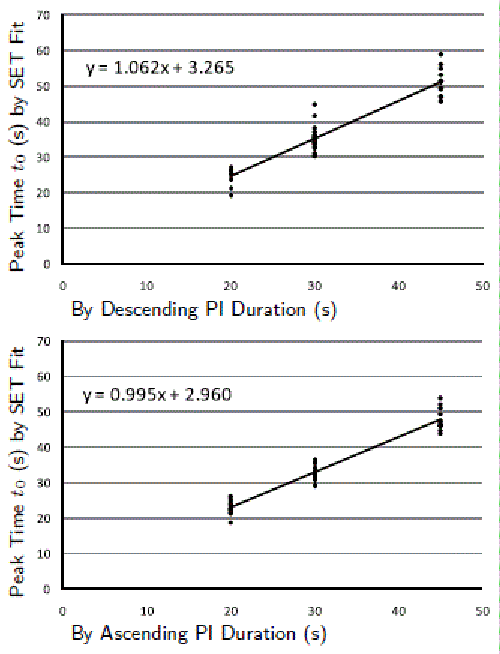
| Figure 5: Scatter diagrams of the peak time t0, indentified by fitting SET to the data. Data from sessions forming part of a descending sequence are presented in the upper panel, and those forming part of an ascending sequence are presented in the lower panel. See Table 3 for the exact numberof sessions of each type for each group of subjects. |