|
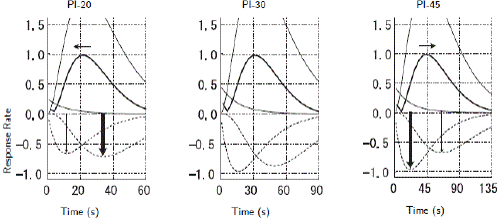
| Figure 8: Graphs of s Rs (t) (bold curve). Data are those presented in Table 5. The two broken curves are the graphs of c1(s) X1(t) (left, each) and c3(s) X3(t) (right, each), whose ratio determines the shape of s Rs (t) . See Hasegawa and Sakata 2015, Figures 7 and 8, for an explanation of the shifts in the peaks. |