|
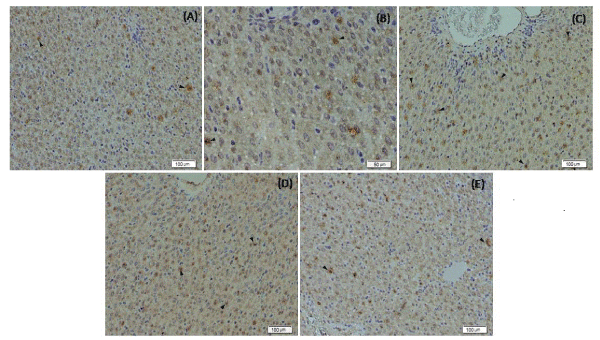
| Figure 6: Photomicrographs of immunohistochemical staining (anti-Caspase-3 antibody) in liver sections. Figure 6A and 6B: Control group. Figure 6C: Lornoxicam -treated group. Figure 6D: LOR+ Basil oil-treated group. Figure 6E: LOR+ M. oleifera -treated group. Detectable caspase-3 activity (arrowheads) were observed in all group’s livers, higher positively intracytoplasmic brown expression of Caspase-3 were noticed in Lornoxicam-treated group. IHC staining counterstained with haematoxylin. Values are expressed as mean ± S.E.M. and analyzed using one-way ANOVA followed by the Duncan analysis at P<0.05. aP compared to control, # P compared to lornoxicam and LOR+M. oleifera - treated groups, xP compared to lornoxicam and LOR+basil oil- treated groups. |