 |
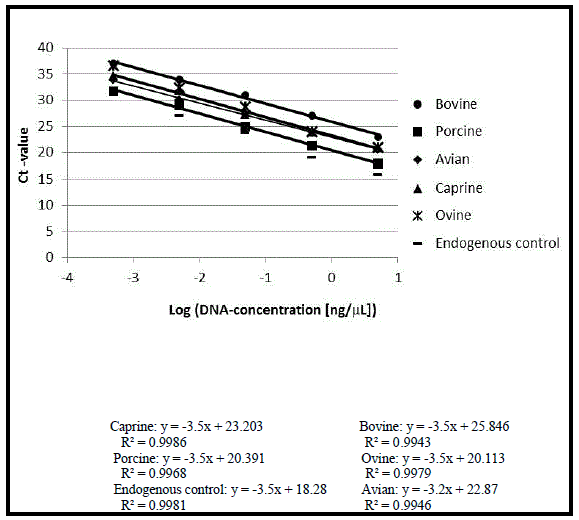
| Figure 1: qPCR tests of 10-fold serial dilutions of DNA templates from 50 ng/μl (100%) to 0.5 pg obtained from blood samples of ruminant species (bovine, caprine and sheep), porcine, avian (chicken) and endogenous controls. Ct values obtained from reference samples of animal blood, corn and soybeans were plotted against the logarithm of DNA concentrations. The R-squared values and slopes were determined for each species. |