 |
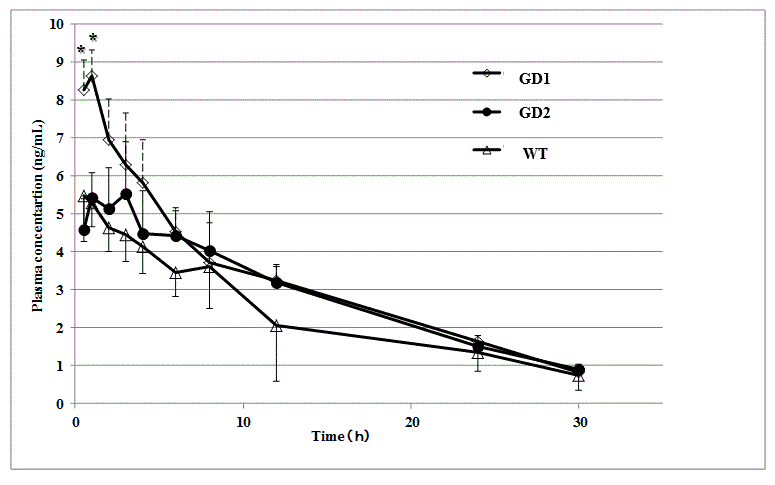
| Figure 4: Plasma concentration-time profile of metoclopramide in gene deletion 1 (GD1), gene deletion 2 (GD2) and wild-type (WT) cattle after oral administration at a dose of 0.4 mg metoclopramide /kg ( mean +/- standard deviation, n=4, *: significant difference between GD1 and other types (GD2 and WT) (P<0.01). |