 |
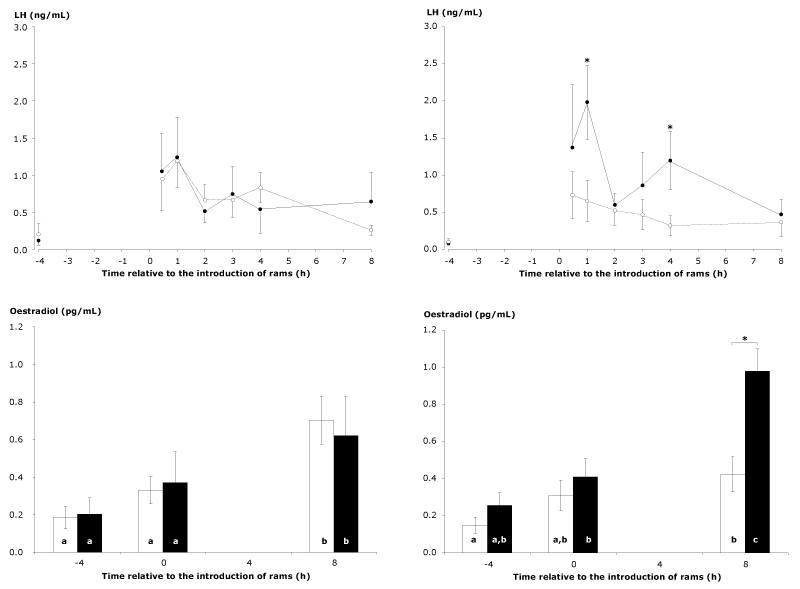
| Figure 2: Experiment 1 – The left hand graphs show the plasma concentrations of LH and oestradiol in ewes before and after the introduction of rams, in control ewes (◯ and open bars; n=14) and ewes that were fed a daily supplement of 400 g of crushed maize and 100g of soya meal (● and hatched bars; n=14) for 5 days immediately before the introduction of rams. The right hand graphs show the plasma concentrations of LH and oestradiol in the same ewes before and after the introduction of rams, but categorised by body condition score into medium (◯ and open bars; n=16) and high BCS (● and black bars; n=12) groups. There was no overlap of BCS between the groups. Time points with different superscripts are significantly different and an asterisk (*) indicates a significant difference between treatments within times (P<0.05). |