 |
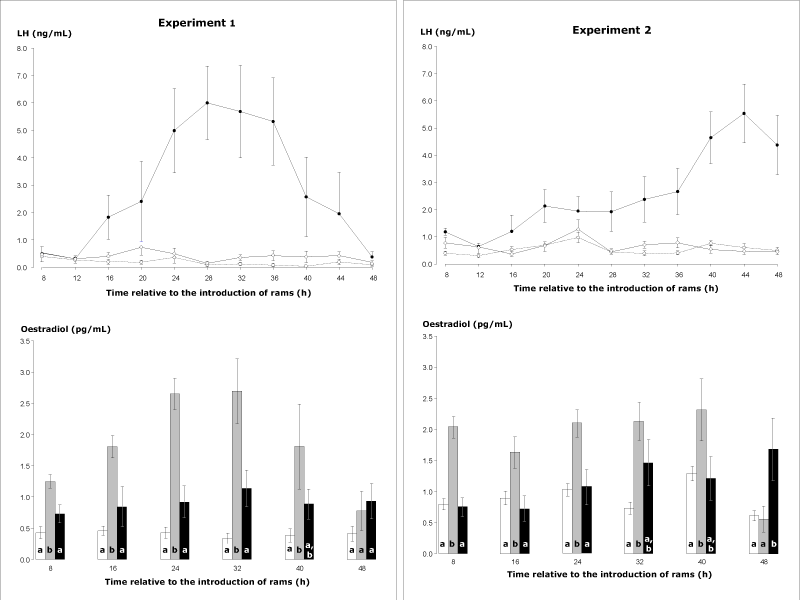
| Figure 4: Experiments 1 and 2 –The plasma concentrations of LH and oestradiol in ewes of ewes between 8 and 48 hours after the introduction of rams with (i) a LH surge (● and grey bars), (ii) ewes without a LH surge and no increase in the concentration of progesterone following the introduction of rams (◯ and open bars) and (iii) ewes without a LH surge but with an increase in the concentration of progesterone following the introduction of rams (◊ and black bars). Experiment 1 on the left; LH surge (n=5), no LH surge (n=14) and Atypical (n=9) and experiment 2 on the right LH surge (n=13), no LH surge (n=39) and Atypical (n=8). For the LH data, P values are presented in the text and for the oestradiol data values with different superscripts are significantly different (P <0.05). |