|
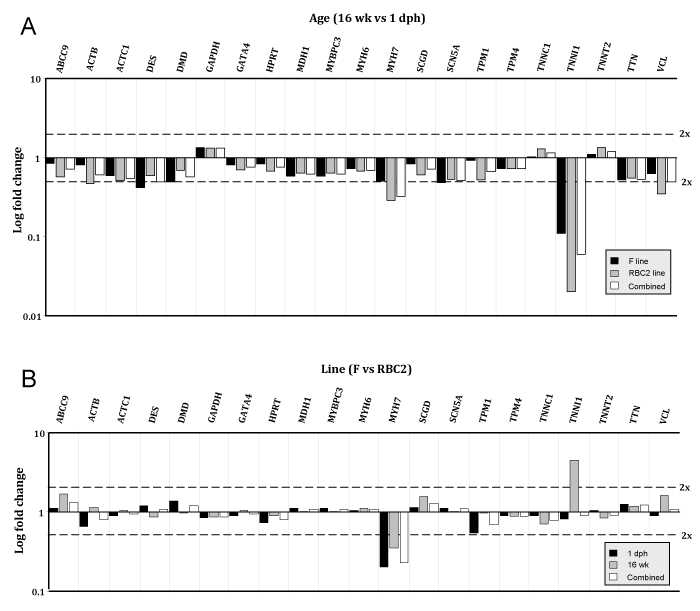
| Figure 3: Log fold change observed at 21 genes in the multiplex CEQ analysis. A) Comparison between developmental time points (Age; 16 wk versus 1 dph) within genetic lines and for all individuals combined. B) Comparison between genetic lines (F and RBC2) within developmental time points and for all individuals combined. Dashed lines indicate 2x fold change. |