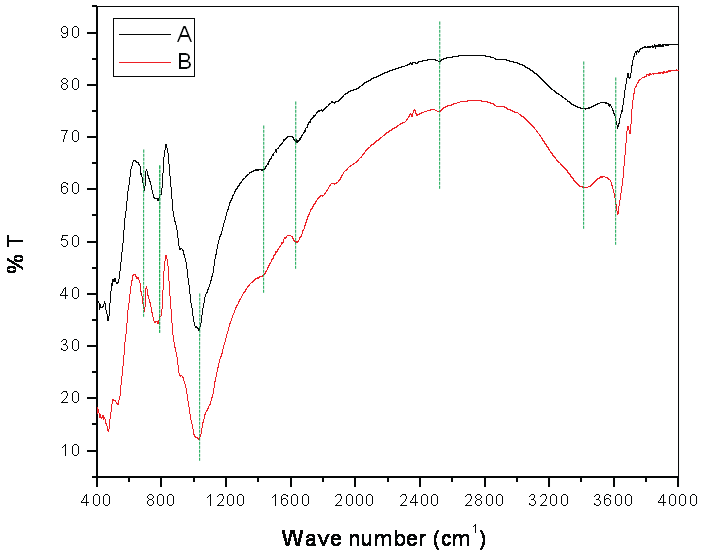
Figure 6:
FTIR images of soil. Spectrum A indicates soil before adsorption of phenol; Spectrum B indicates soil before adsorption of phenol; dotted green lines indicate peak sizes before and phenol.