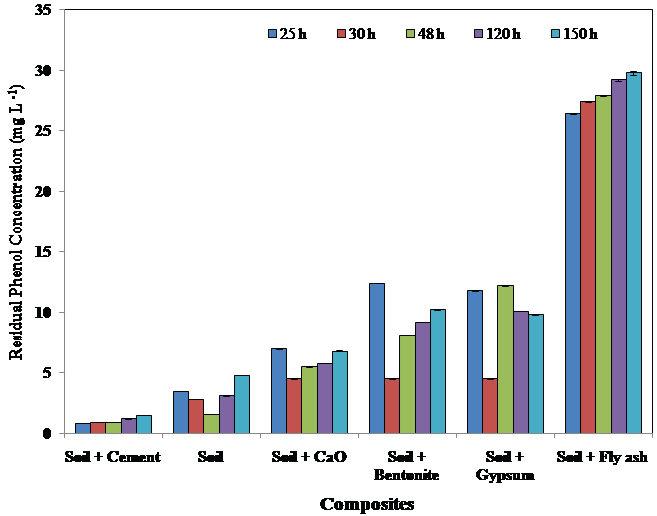
Figure 7:
Graph showing residual phenol concentration (mg L
-1
) of phenol solution passing through the columns containing soil and different soil composites with respect to time.