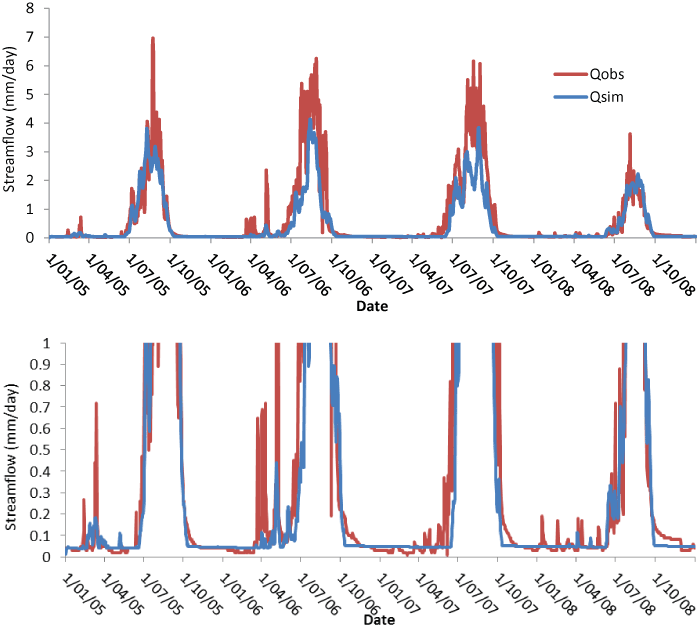
Figure 5:
The observed and simulated streamflow in the Melka Kuntrie subbasin for validation periods (2005-2008),the lower pannel indicates the zoomed in observed and simulated streamflow.