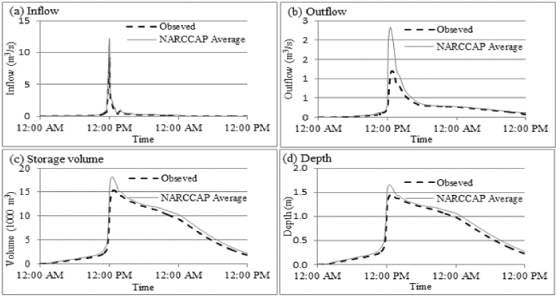
Figure 6:
Plots showing time series of inflow, outflow, storage volume and depth from 25 year return period storm for detention pond 1 (observed/baseline values obtained using storm depths calculated from observed data).