|
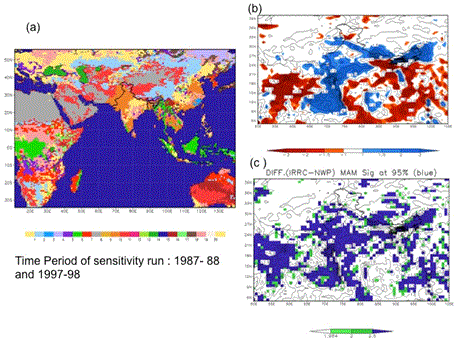
| Figure 11:Irrigation experiment 2 (IR 2) (a) sensitivity vegetation map of IR 2. (b) Pre-monsoon (MAM) precipitation changes for year 1987 ((El Niño+ drought year) and (c) precipitation change (mm/day) for MAM-1987 significant at 95% (95% significant grid cells are shaded with green color) and 99% level of significance (99% significant grid cells are shaded with blue color). |