 |
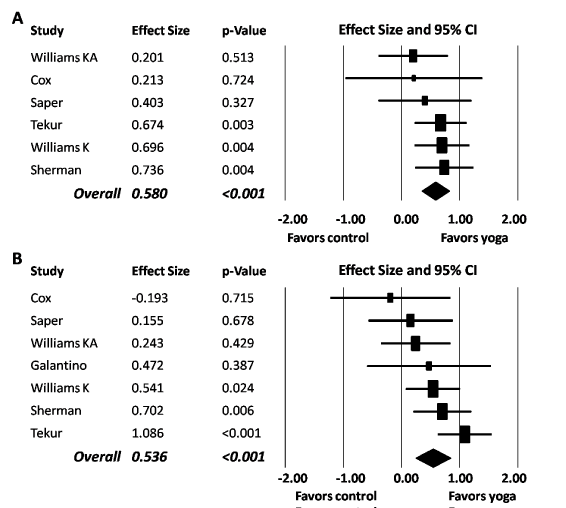
| Figure 1: Forest plot of effect sizes from studies that assessed the effect of yoga on low back pain (A) or functional ability related to low back pain (B). A square represents the effect size for a given study with the size of the square being proportional to the weighting of that study in the meta-analysis. A horizontal line indicates the 95% confidence interval (CI) for an effect. Studies are arranged from the lowest to highest effect size. The diamond at the bottom represents the overall effect size calculated using a randomeffects model. The width of the diamond represents the 95% CI for the overall effect size. |