 |
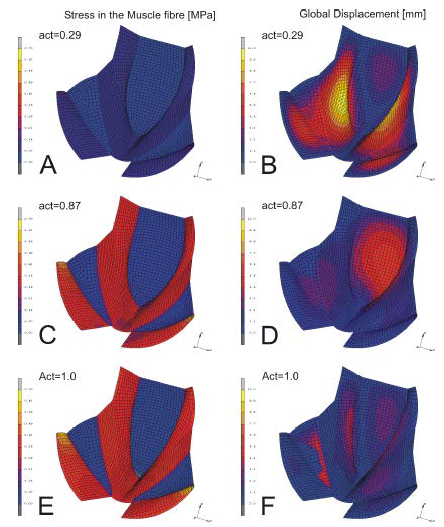
| Figure 2: Graphical results of the FE analysis of the pelvic floor muscles. The stress in the muscle fiber direction in MPa is displayed in the left column, displacement in millimeters in the right column. The 'active' stress in the connective tissue is zero in image A, C and E, since it is passive tissue. The same scale is used for all three load-cases. Three particular examples are displayed for three conditions: LC1 (rest): 29% activation, 0.01 kPa load - Images A and B; LC2 (max IAP): 87% activation, 5.4 kPa load - Images C and D; LC3 (max ACT): 100% activation, 1.3 kPa load - Images E and F). (Text and figure with permission from Janda, 2006). |