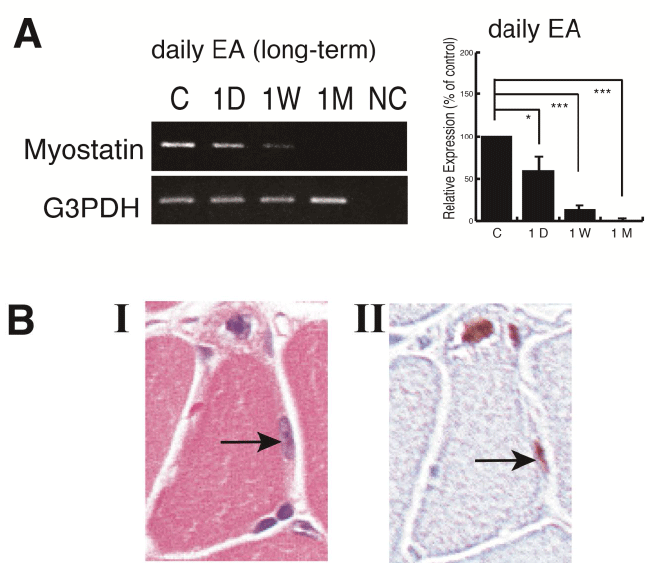
Figure 1: (A) The effect of long-term treatment of EA on skeletal muscle.(A) RT-PCR analysis of myostatin gene expression. G3PDH was used as a loading control. Lanes are as follows: lane C, control; lane 1D, EA stimulation for 1 day; lane1W, after daily EA stimulation for 1 wk; lane 1M, after daily EA stimulation for 1 mo.Relative transcript levels of myostatin are shown (means ± SD). *P< 0.05; NS, not significant.
(B) Histochemical and immunohistochemical analysis for EA-treated muscle. Hematoxylin and eosin (H&E)-staining is I; immunostaining is II. In serial sections, PCNA antibody reacted in satellite cells (I, indicated by the arrow), and nucleoli (II, indicated by the arrow) were found in the same nuclei by H&E staining.Original magnifications: ×100 |