 |
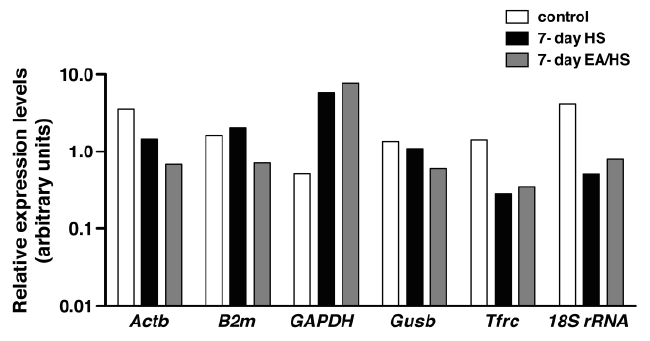
| Figure 2: Logarithmic histogram of the expression levels of housekeeping genes.Actb, beta-actin; B2m, beta 2-microglobulin; GAPDH, glyceraldehyde-3-phosphate dehydrogenase; Gusb, beta-glucuronidase; Tfrc, transferrin receptor; 18S rRNA, 18S ribosomal RNA. White bars, control mice; black bars, 7 days HS mice; gray bars, 7 days EA/HS mice. |