|
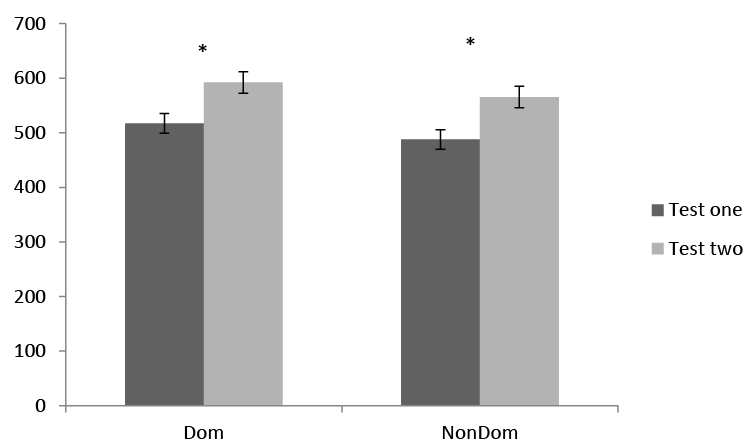
| Figure 3: SEBT Results: Intervention Group - Differences in reach measurements for the intervention group between test one and test two for the dominant leg (Dom), and for the non-dominant leg (NonDom). Note that the differences observed between Test one and Test two for both dominant and non-dominant legs were significant (p = 0.00). |