 |
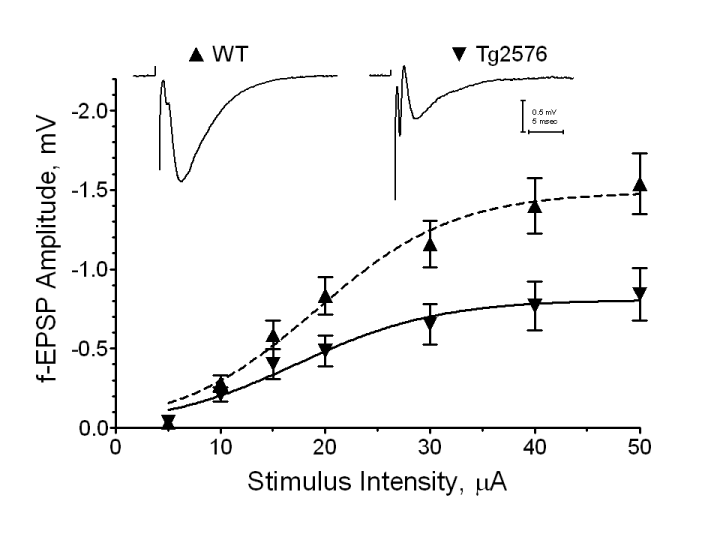
| Figure 1: Input-output curves showing reduced hippocampal transmission in Tg2576 mice. The graph shows f-EPSP amplitudes (mean ± SEM) as a function of stimulus intensity in the CA1 stratum radiatum. Sensitivity to electrical stimulation was similar between Tg2576 and WT mice, while response amplitudes, including the maximal response at 50 µA, were, on average, lower in Tg2576. Curves fit to the data were significantly different by global analysis F-test (P < 0.0001). The insets show example responses from WT (left) and Tg2576 (right) slices. Scale bars represent 0.5 mV by 5 ms and apply to both traces. |