 |
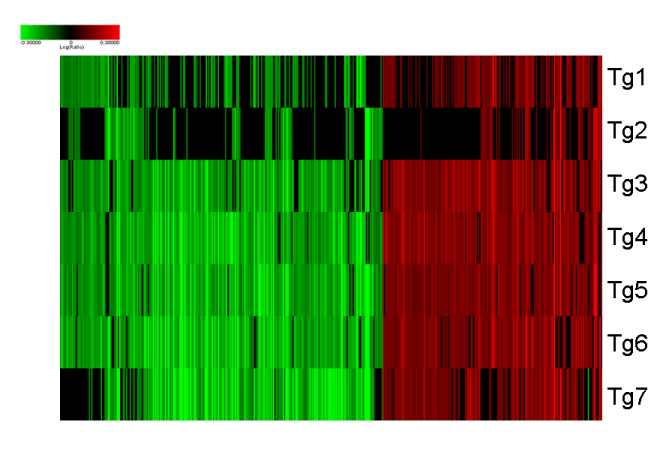
| Figure 4: Heatmap showing gene expression changes in hippocampus from Tg2576 mice relative to WT controls. The heatmap shows individual expression profiles from Tg2576 mice relative to an in silico pool of WT control mice. The genes shown (452) were significantly regulated, with a p-value of 0.05 or less in at least 5 Tg2576 mice. Genes shown in green are downregulated, while genes shown in red are upregulated relative to WT controls. Genes shown in black were not significantly changed in expression. |