 |
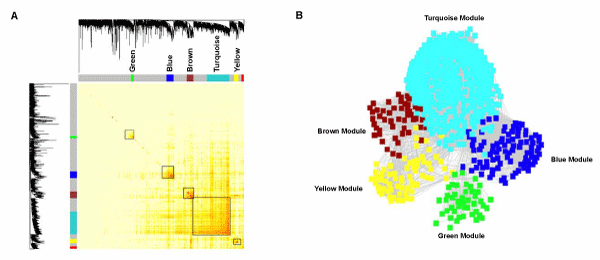
| Figure 1: The Human Liver Gene Co-Expression Network of All Genes with Sex Differences. (A) Topological overlap matrix (TOM) of all 3,548 sexually differentially expressed genes. Both the rows and the columns are sorted by hierarchical clustering. The colors specify the strength of the pair-wise topological connections (yellow: not significantly connected; orange: highly connected). Genes that are highly connected within a cluster are defined as a module. Each module was assigned a unique color identifier (turquoise, blue, green, yellow and brown), with the remaining genes colored gray; (B) The visualization of the co-expression network for sexually differentially expressed genes. The graph highlights that genes in the liver coexpression network fell into five distinct modules, where genes within a module were expressed with a higher correlation with each other than that of genes outside this module. |