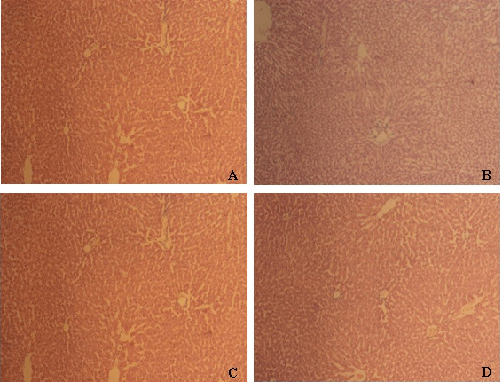
(A) Vehicle control animals showing clear hepatic lobule, radial liver cell cord and clear hepatic sinusoid; (B) potassium iodate 50 mg/kg; (C) potassium iodate 85 mg/kg dose treated animals and (D) potassium iodate 150 mg/kg dose treated animals all showing normal liver architecture and hepatocytes (10×).