 |
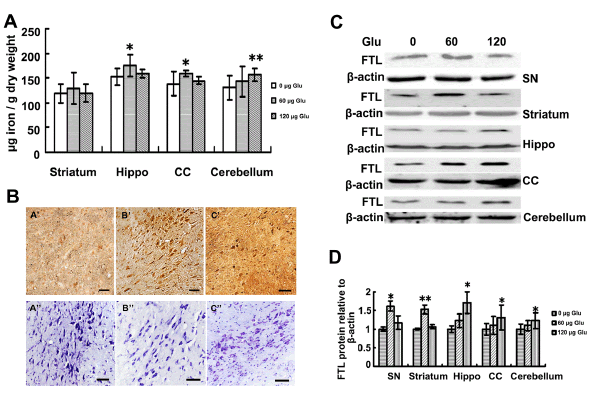
| Figure 1: Iron contents were increased in rat brain after ICV of Glu. A shows the non-haem iron contents in striatum, hippocampus, CC and cerebellum. B shows the non-haem iron staining (A’ B’) and nissle staining (A’’ B’’) in SN after Glu treatment. A’, A’’: ACSF, B’, B’’: 60 μg Glu, C’, C’’: 120 μg Glu. C shows the expression of FTL protein (iron storage) with western blot. D shows the analysis of immunostained bands in C and its statistics. The expression of FTL was normalized to β-actin and all represented data was the relative values to ACSF group (0 μg Glu). All Data were expressed as means ± SD. * p<0.05 vs. 0 μg Glu, **p<0.01 vs. 0 μg Glu (n=6). |