|
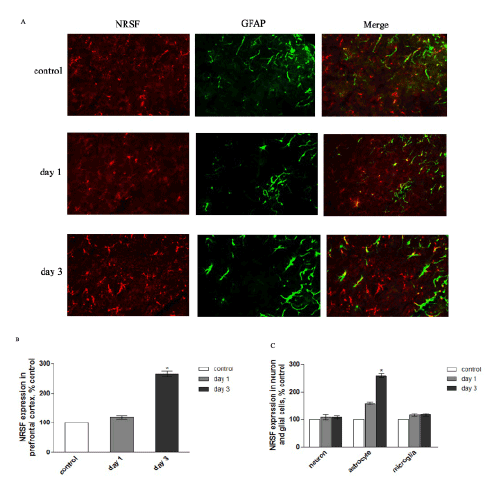
| Figure 1: Cellular NRSF expression during traumatic stress. (A) SD rats were divided into three groups: control, day 1, and day 3 (1 and 3 days after trauma; n=5). Cross-sections of the frontal cortex were subsequently immunostained by anti-NRSF and Alexa594 antibodies, and anti-GFAP and Alexa488 antibodies, and analyzed by Leika Q500IW image analysis system (Leika Inc., Germany). Scale bars, 50 μm. Panels (B) and (C) show quantitative analysis of NRSF expression, and co-localization of NRSF with GFAP, tubulin and CD11b/c, respectively. Data were calculated as percentage of control; each value represents the mean ± S.E.M. of three independent experiments. *p<0.05 vs. control. |