 |
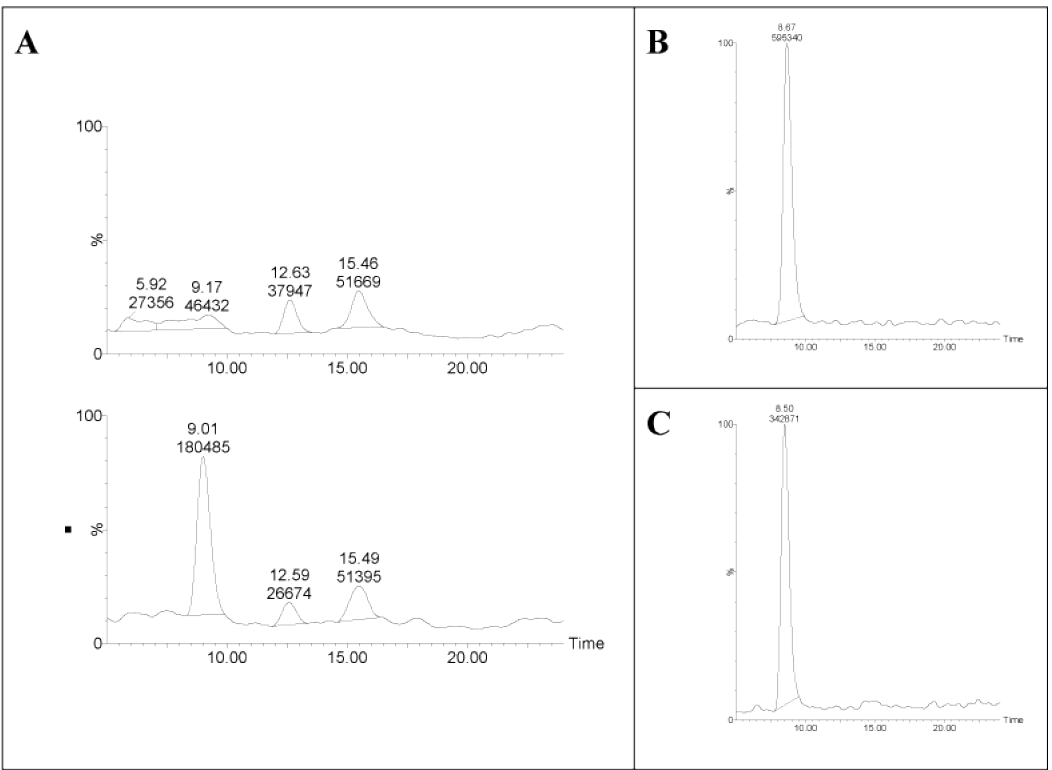
| Figure 2: Metabolites formed after 120 minute incubation of BAT (10 μM) with HLM. A) LC-MS chromatogram of HLM incubated with BAT. Top: MS scan m/z 266 -NADPH. Bottom: MS scan m/z 266 + NADPH; B) LC-MS chromatogram of HLM +NADPH incubated with d3-BAT for 120 min MS scan m/z 268 and C) LC-MS chromatogram of HLM +NADPH incubated with d4-BAT for 120 min MS scan m/z 270. |