 |
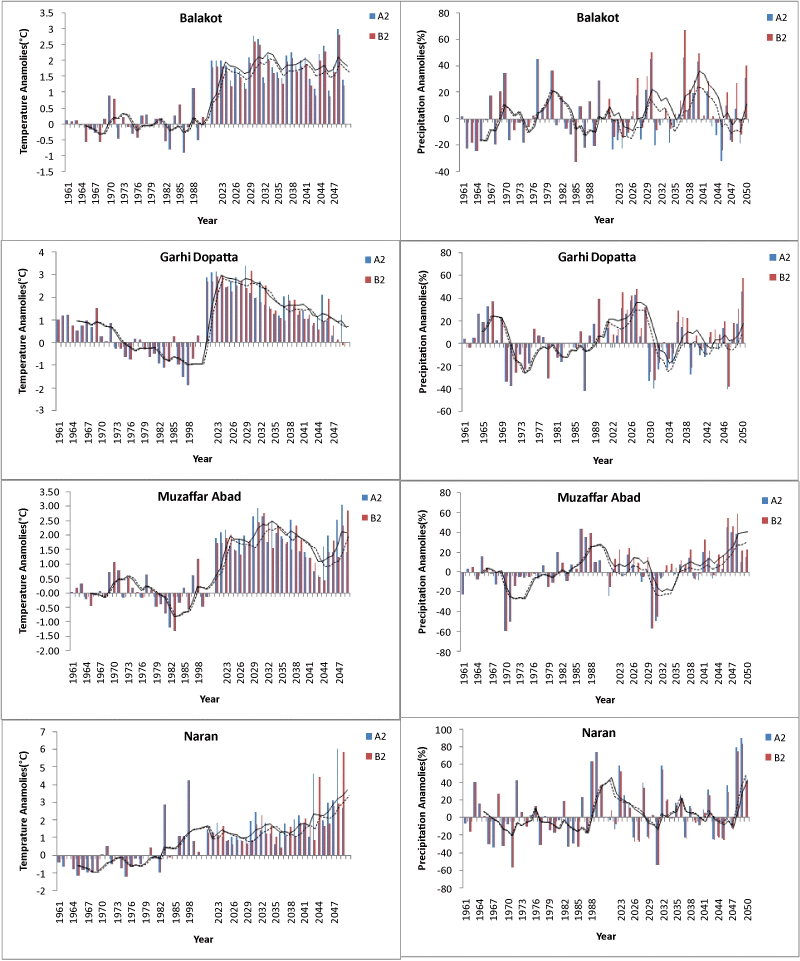
| Figure 10: Anomalies of annual mean temperature (left) and precipitation (right) at four stations in the upper Jhelum basin for the period 1961-2050 relative to mean of 1961-1990. The solid line shows five year moving average trend under A2 scenario while the dotted line shows the same under B2. |