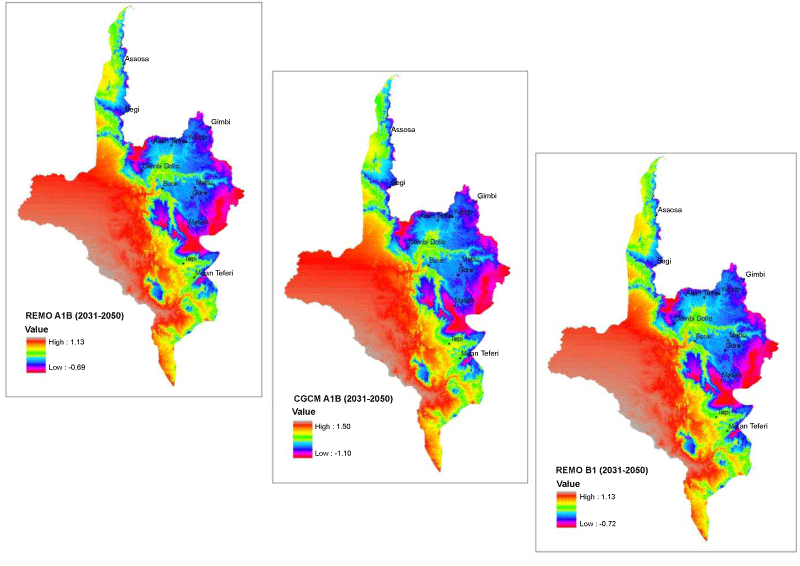
Figure 9:
Spatial Change in annual maximum temperature 2031-2050 (with respect to 1972-2000) for REMO and CGCM3.1).