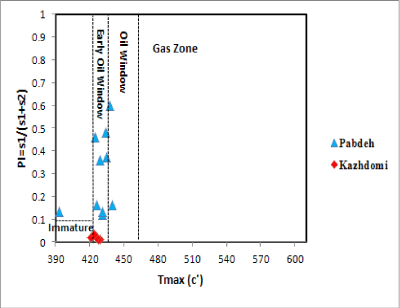
Figure 11:
Diagram of production index Vs T
max
.