 |
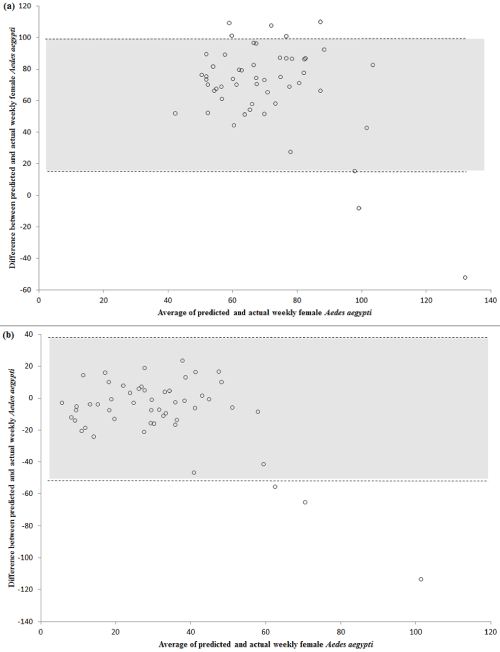
| Figure 5: Altman [20] agreement plot showing the difference between each pair of average predicted and actual weekly female Aedes aegypti (horizontal axis) plotted against the difference between predicted and actual weekly female Aedes aegypti (vertical axis). Values between the dashed lines (lightly shaded regions) are within the limits of agreement [Note: This is an assessment for results of model 1(a) and model 2(b)]. |