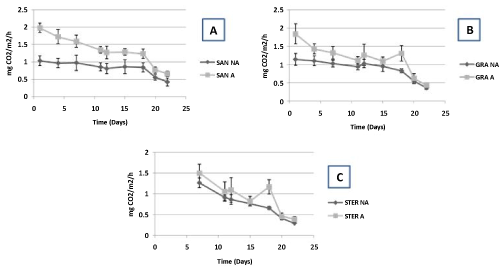
Figure 4:
CO
2
efflux (mg CO
2
/m
2
/h) in sandstone (A), granite (B) and sterilized (C) microcosms in limed (A) and control (NA) soil samples.