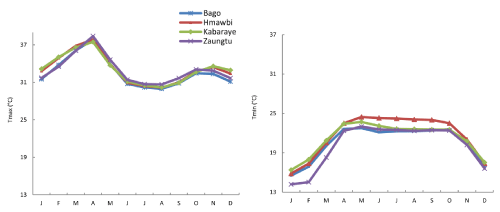
Figure 2:
Distribution of average monthly T
max
and T
min
for all the meteorological stations in the Bago River Basin for 1975–2005 (the baseline period).