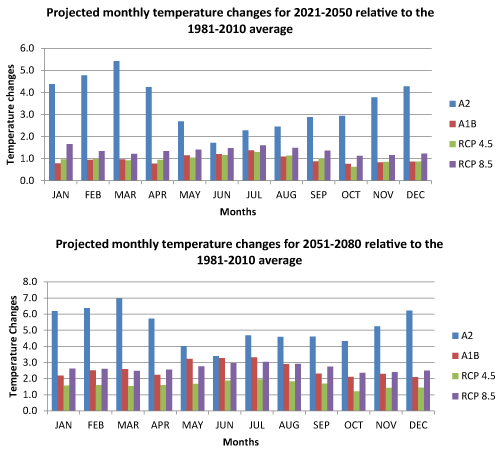
Figure 14:
Comparative graphs showing Monthly temperature projection changes under SRES scenarios and RCPs for the near future (Top) and far future (below) relative to 1981-2010 climate period.