 |
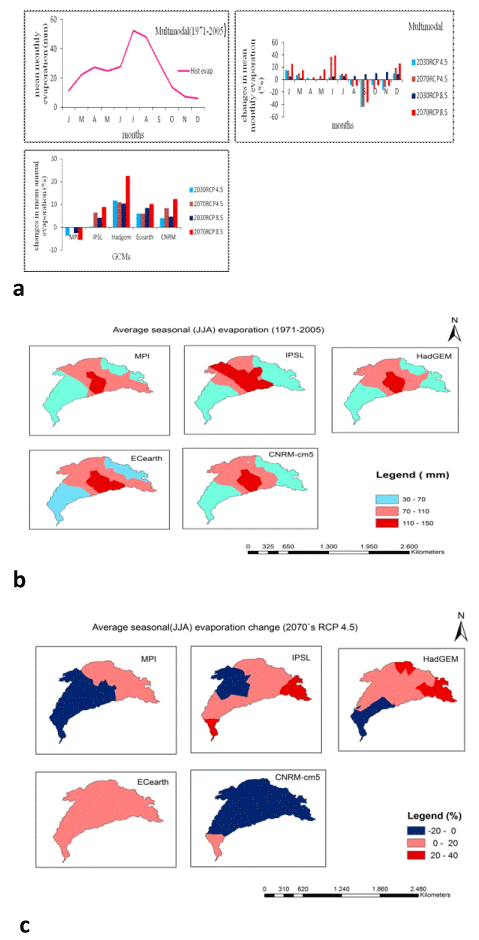
| Figure 6: Multimodal base line average monthly evaporation (1971-2005),average monthly and annual evaporation change of five GCMs for 2030`s and 2070`s under RCP 4.5 and RCP 8.5 emission scenarios as compared to base line period (a), five GCMs spatial distribution of base line average seasonal evaporation (b), five GCMs spatial average seasonal evaporation change for 2070`s of RCP 4.5 as compared to base line period (c). |