 |
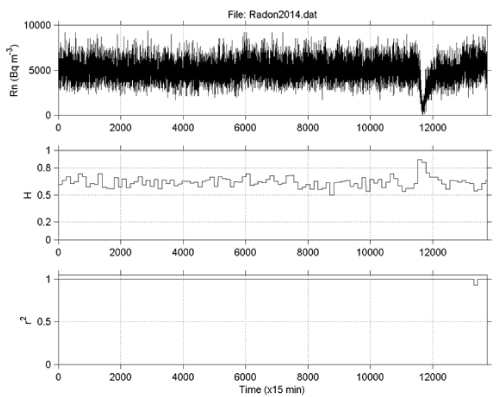
| Figure 6: R/S analysis through lumping with step of 128 samples. From top to bottom: (a) the radon signal of Figure 2a; (b) the evolution of Hurst exponent calculated through R/S analysis; (c) evolution of the square of the associated Spearman's correlation coefficient. |