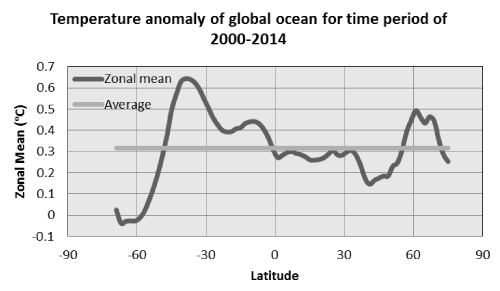
Figure 5:
Latitudinal zonal mean of ocean surface temperature anomaly of 2000-2014. (Hansen et. al., 2010; Source
http://data.giss.nasa.gov/gistemp/maps/
).