 |
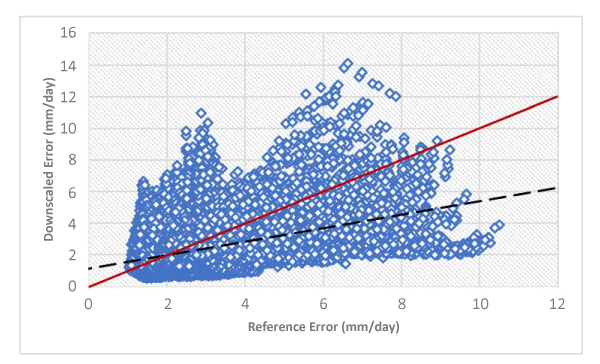
| Figure 18: The relationship between model bias and downscaling ability for 2010-2099 mean precipitation (mm/day) RCP4.5 and RCP8.5 concatenated grids. Shown is the RMS error for LIBC downscaling method (rows) for each of the 30354 grids of QUMP ensembles (dots), as a function of RMS error for linearly interpolated raw GCMs (reference) errors, which is a measure of model bias in projections. The solid (red) line shows equal errors in downscaled and reference projections. The dashed line is the regression of QUMP ensemble members; the slope of which is positive suggesting that smaller the model bias, the smaller the error in mean precipitation. |