 ). These are Class II segments and their mean M is also plotted. Their values are generally lower than the ones of Figure 5.
 |
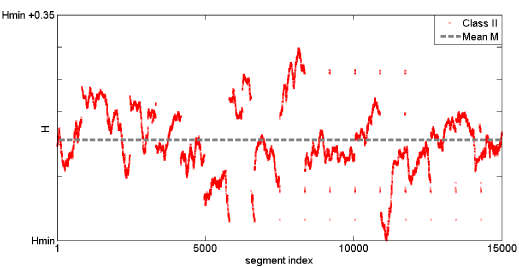
Figure 6: Hurst exponents based on the R/S method for a random set of segments tagged as not successive fBm by the powerlaw wavelet method (for r2 ≤ 0.95 and 1< b < 3 , or for  ). These are Class II segments and their mean M is also plotted. Their values are generally lower than the ones of Figure 5. ). These are Class II segments and their mean M is also plotted. Their values are generally lower than the ones of Figure 5. |