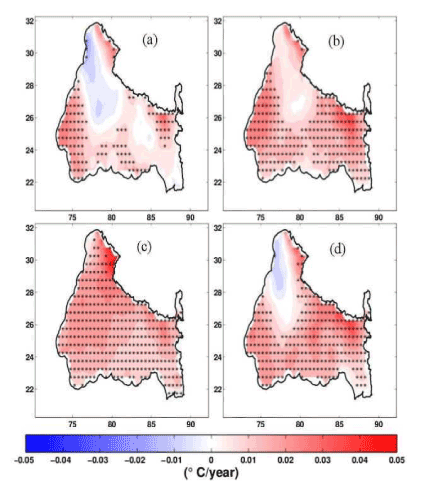
Figure 3:
Bayesian trend of mean temperature (◦Cyear
-1
) for (a) winter, (b) pre-monsoon, (c) monsoon and (d) post-monsoon seasons. Asterisks (*) are points with 0.90 credible level trend (p<0.1).