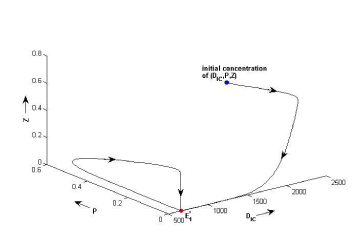
Figure 4: B. Phase space diagram of system (Eq.1, Eq.2, Eq.3). This figure shows that with any initial concentration of (DIC, P, Z) which is denoted by blue bullet, system converges to Zooplankton free equilibrium point  ( ( ) which is indicated by red bullet. Parameter are: rphy=0.24; rzoo=0.25; P_psyn=2.;k_DIC=1.5; r_cp=0.43; l_rt1=0.09; g_rt=0.6; k_z=0.02; m_rp=0.03; l_rt2=0.01; p_rz=0.22; r_ex=0.01; m_rz=1.15; l_rt3=0.1; I=30; s_e=3.32; s_r=1.64. ) which is indicated by red bullet. Parameter are: rphy=0.24; rzoo=0.25; P_psyn=2.;k_DIC=1.5; r_cp=0.43; l_rt1=0.09; g_rt=0.6; k_z=0.02; m_rp=0.03; l_rt2=0.01; p_rz=0.22; r_ex=0.01; m_rz=1.15; l_rt3=0.1; I=30; s_e=3.32; s_r=1.64. |

