 |
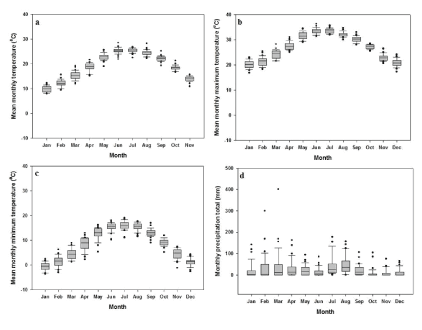
| Figure 2: Boxplots for the Saiq temperature and precipitation monthly series. a) Mean monthly temperature (Tmean); b) Mean monthly maximum temperature (Tmax); c) Mean monthly minimum temperature (Tmin); d) Total monthly precipitation (Precip). Boxes: interquartile range; whiskers 5th and 95th percentiles. |