 |
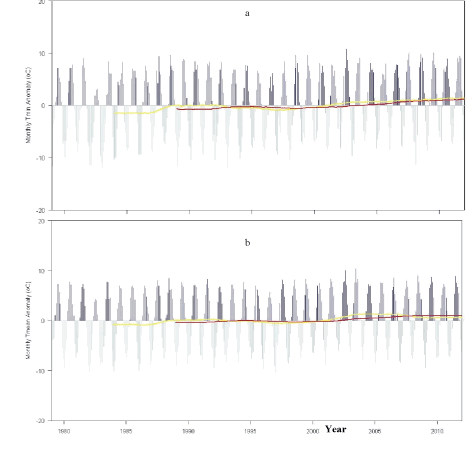
| Figure 3: Anomaly plots for the Saiq temperature raw monthly series. a) Mean monthly minimum temperature (Tmin); b) Mean monthly temperature (Tmean). Blue bars: monthly anomalies from series means. Yellow line: five year running mean for series. Red line: ten year running mean for series. |